Research Areas
Diagnosis of Biological Flows & Biomimetics
Hemodynamics and vascular diseases
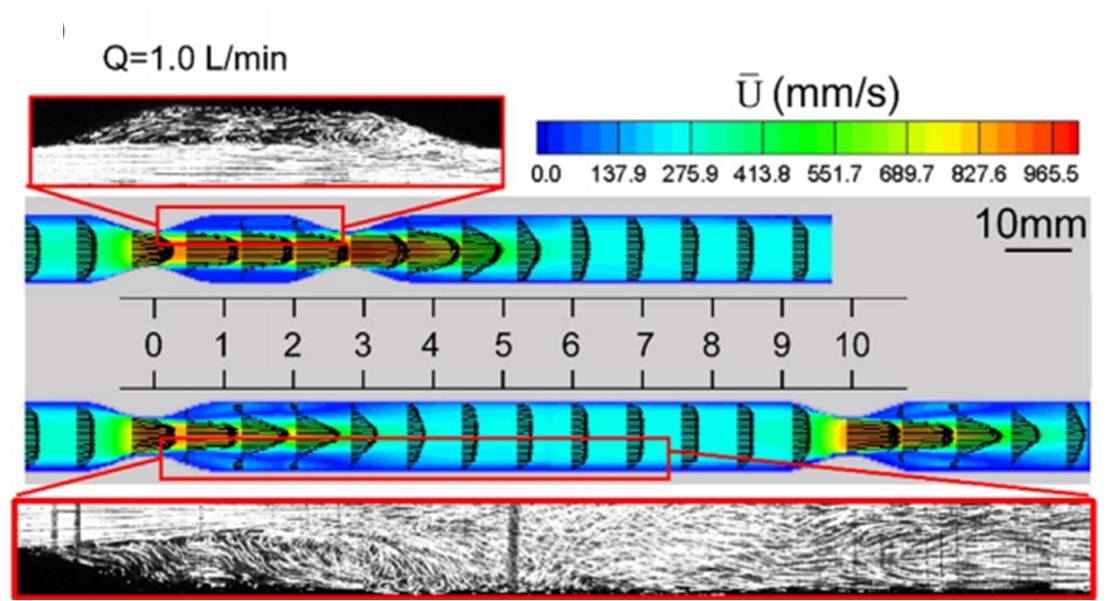
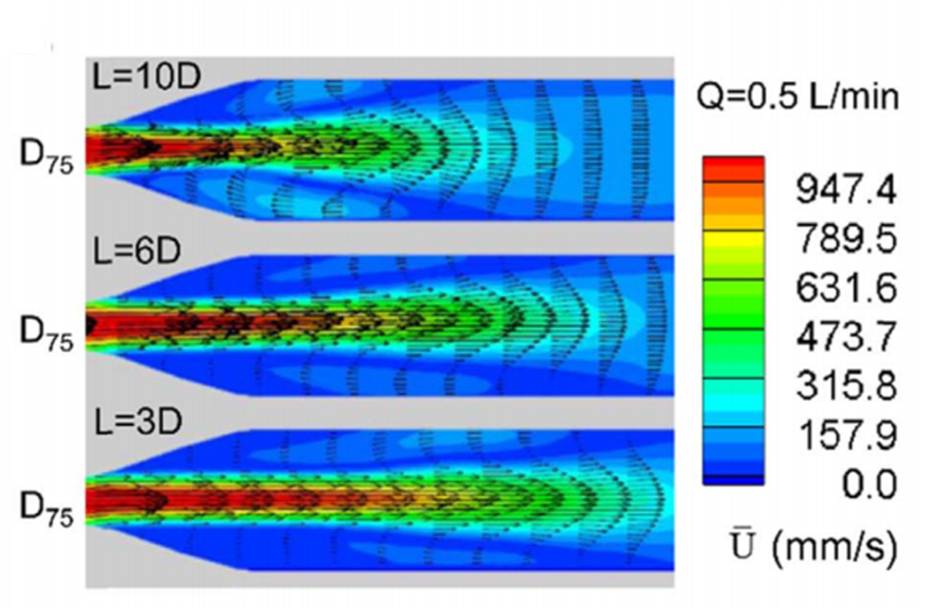
Helical vascular graft for stenotic flow
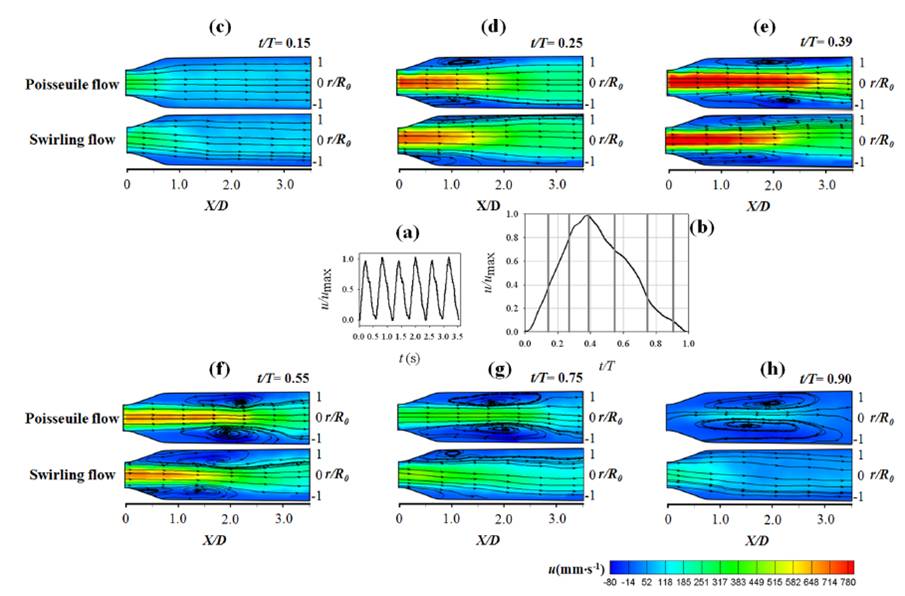
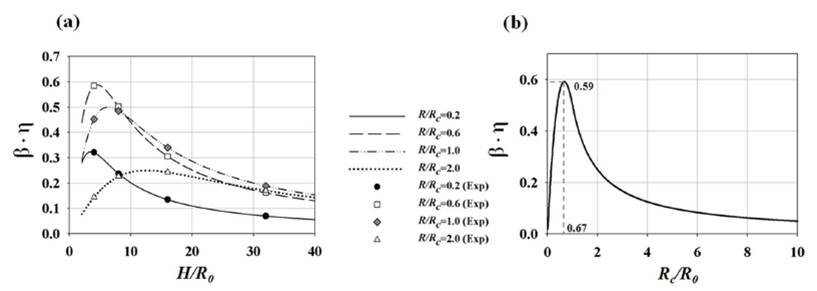
The swirling flow in a helical graft has beneficial influences on a disturbed flow structure such as stenotic flow. The characteristics of swirling flows generated by helical tubes with various helical pitches and curvatures were investigated.
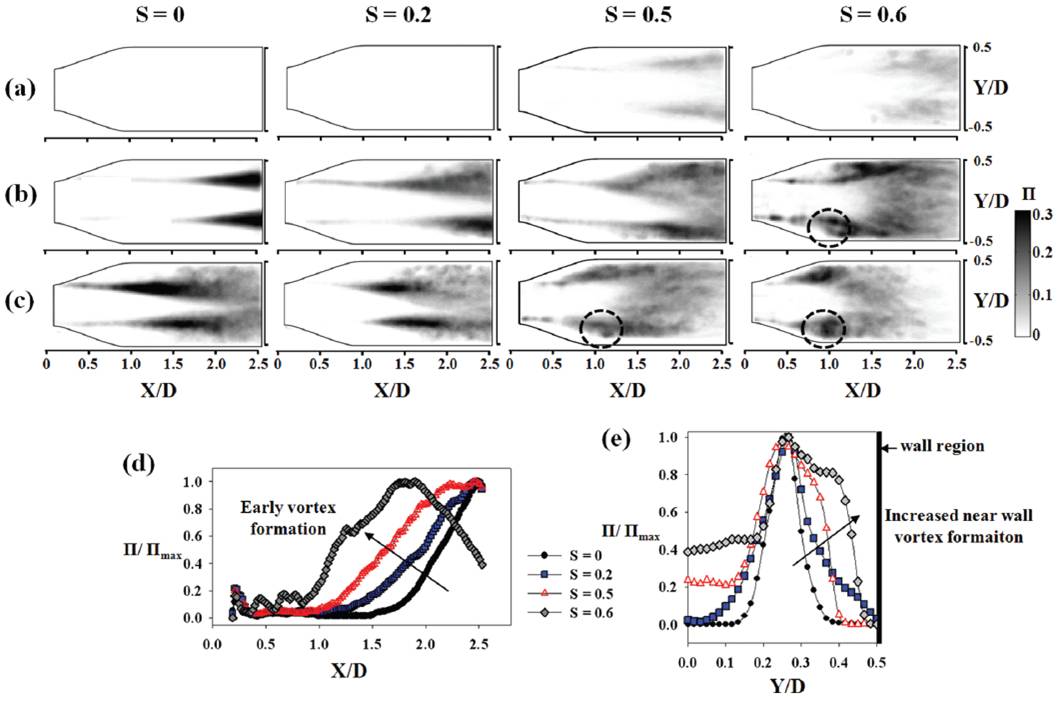
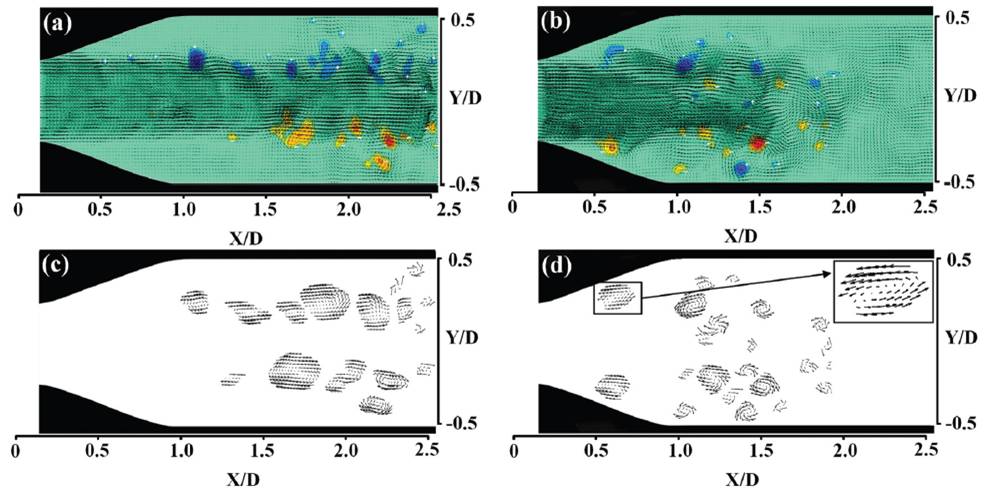
Swirling flow in the anastomosis
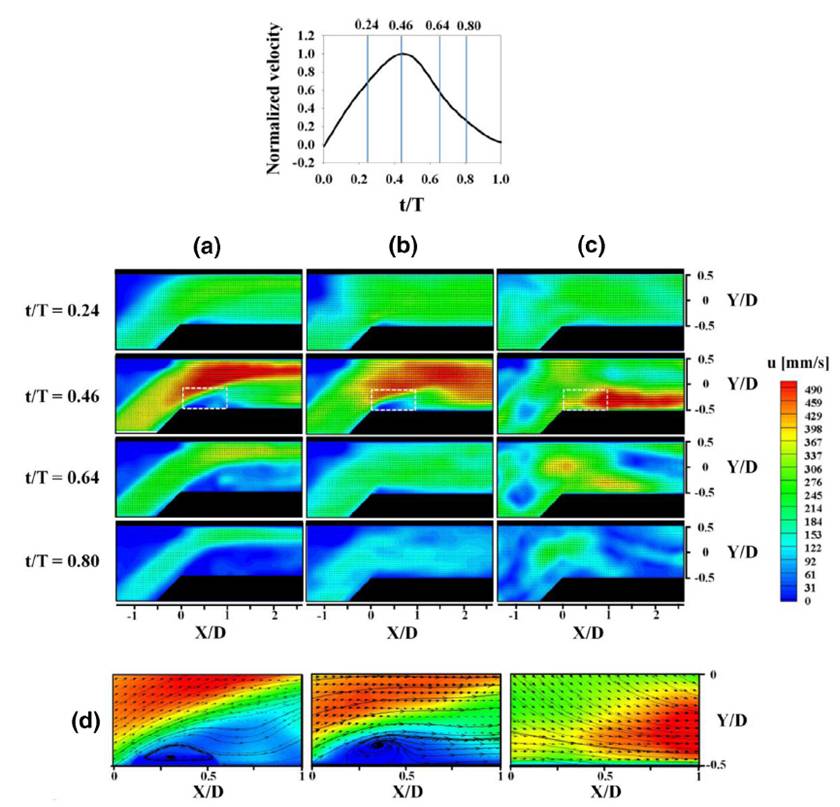
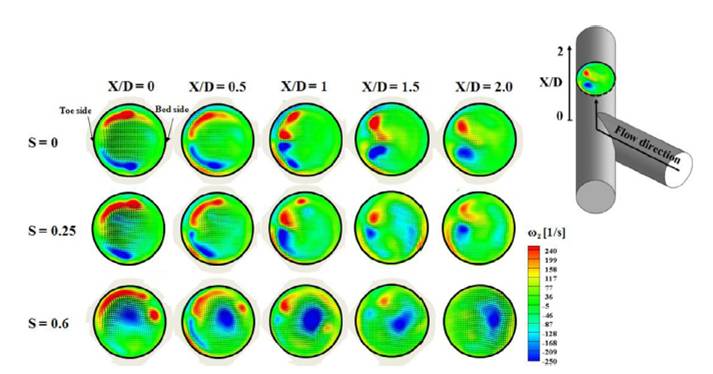
Pathological fluid-dynamic characteristics in a 45°end-to-side anastomosis were experimentally investigated using a particle image velocimetry.
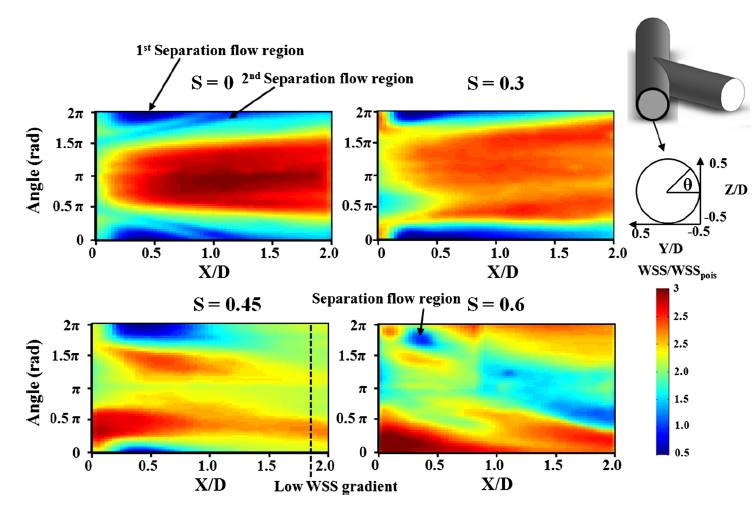
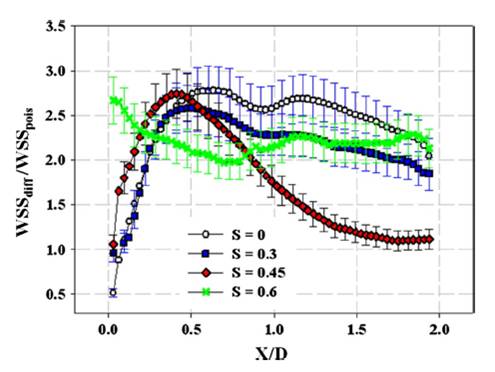
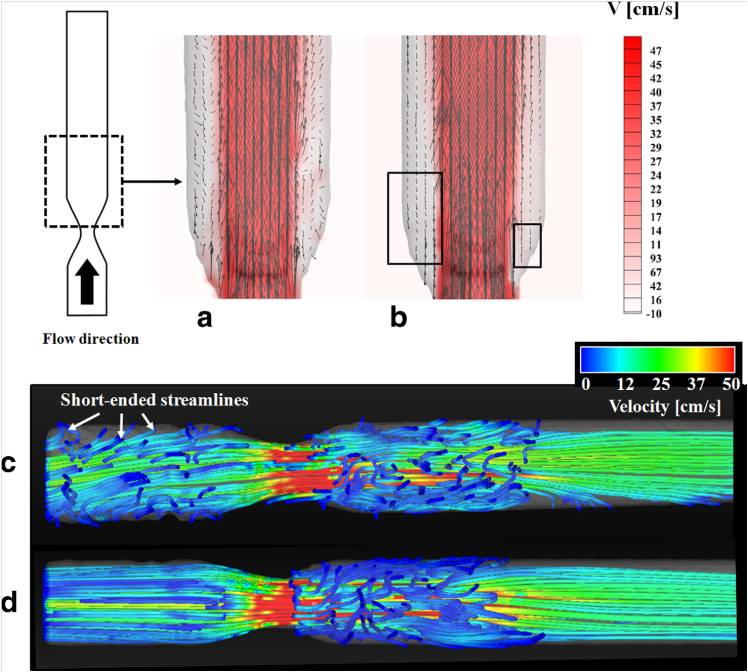
Hemodynamics in tandem stenosis
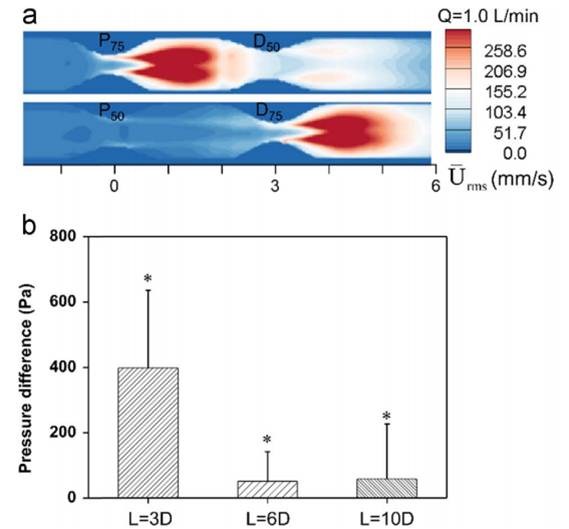
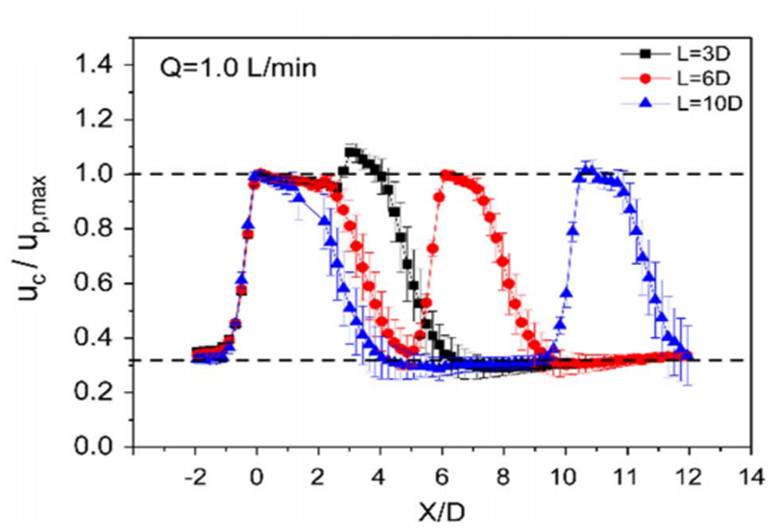
Flow characteristics in tandem stenosis structures were investigated. Interspacing distance between two stenosis and severity of each stenosis affect to flow structures.
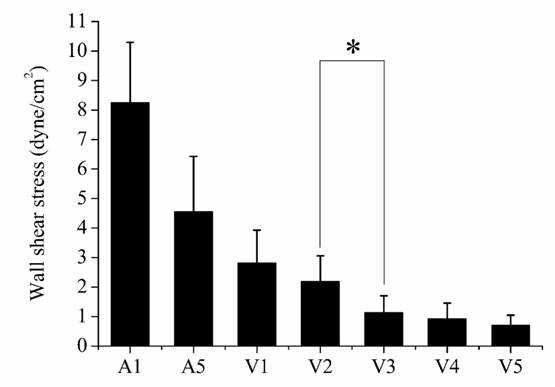
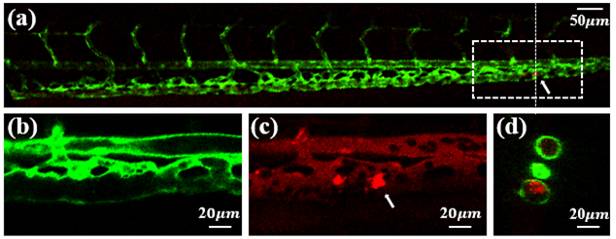
WSS-related atherosclerosis in zebrafish
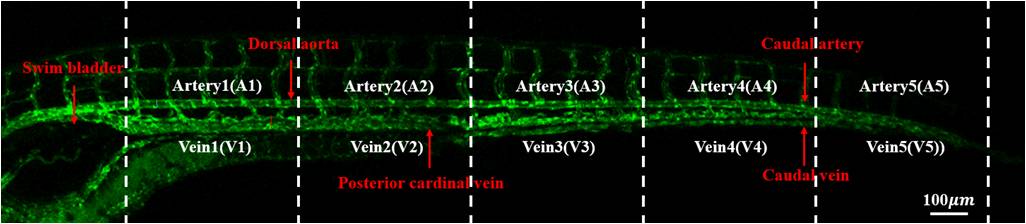
Length of each section: 460μm
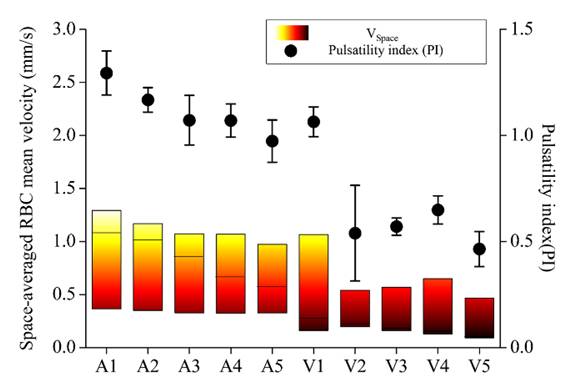
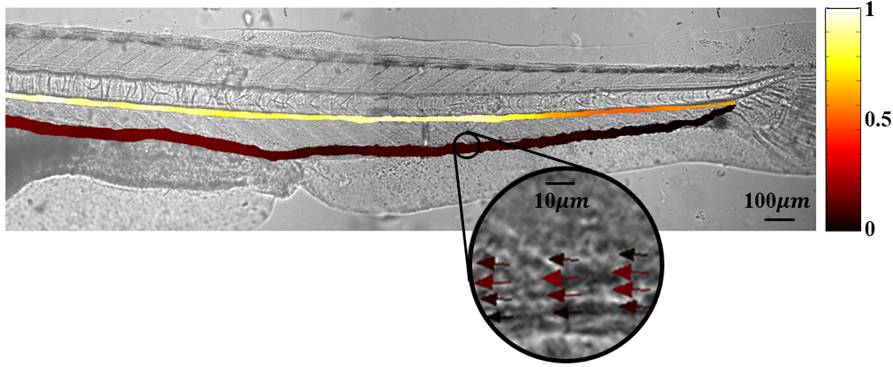
(mean velocity contour map)
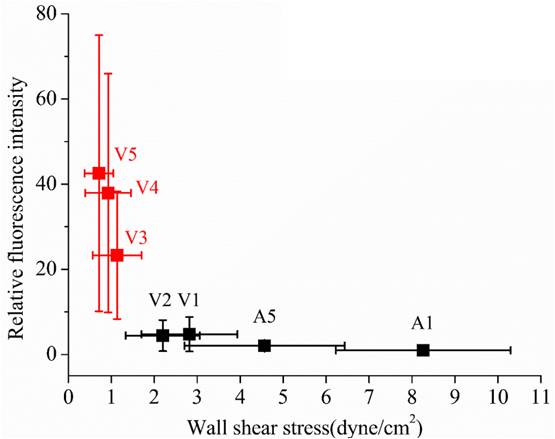
→ Most lipids are deposited in blood vessels with low WSS
→ Cholesterol(4%) + cholesteryl BODIPY 542/563(1%)
→ Most lipids are deposited at veins 3, 4, 5 (caudal vein)
The relation between wall shear stress and cholesterol deposit in blood vessels was revealed in hypercholesterolemic zebrafish model.
Flow measurements using 4D MRI
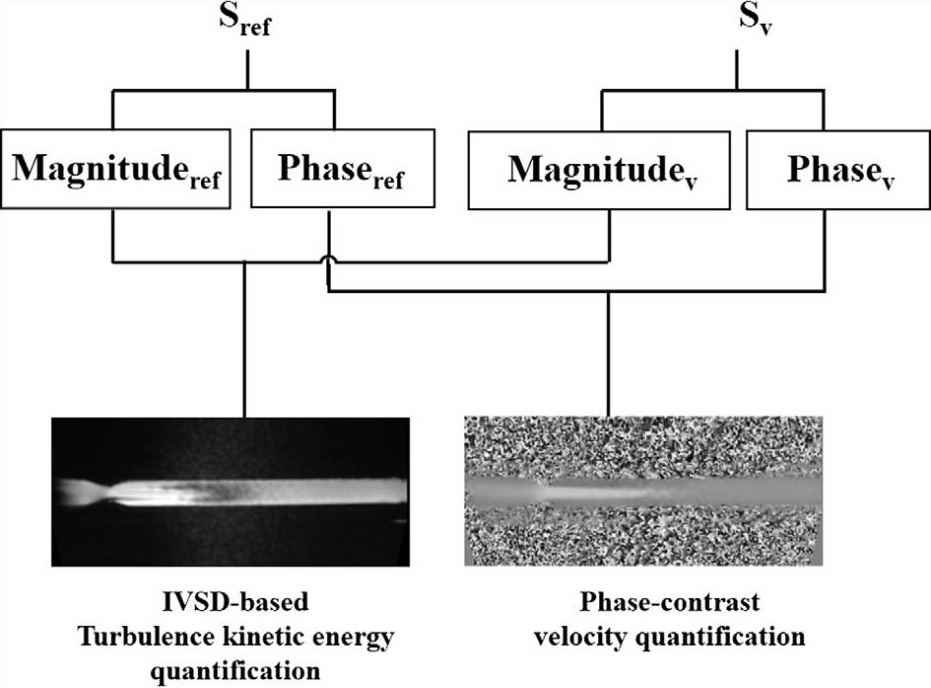
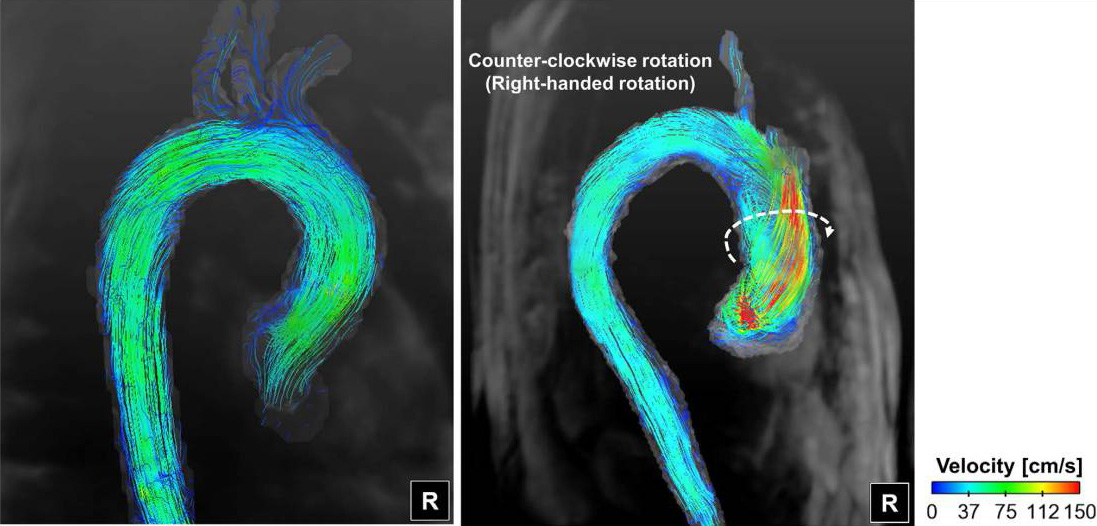
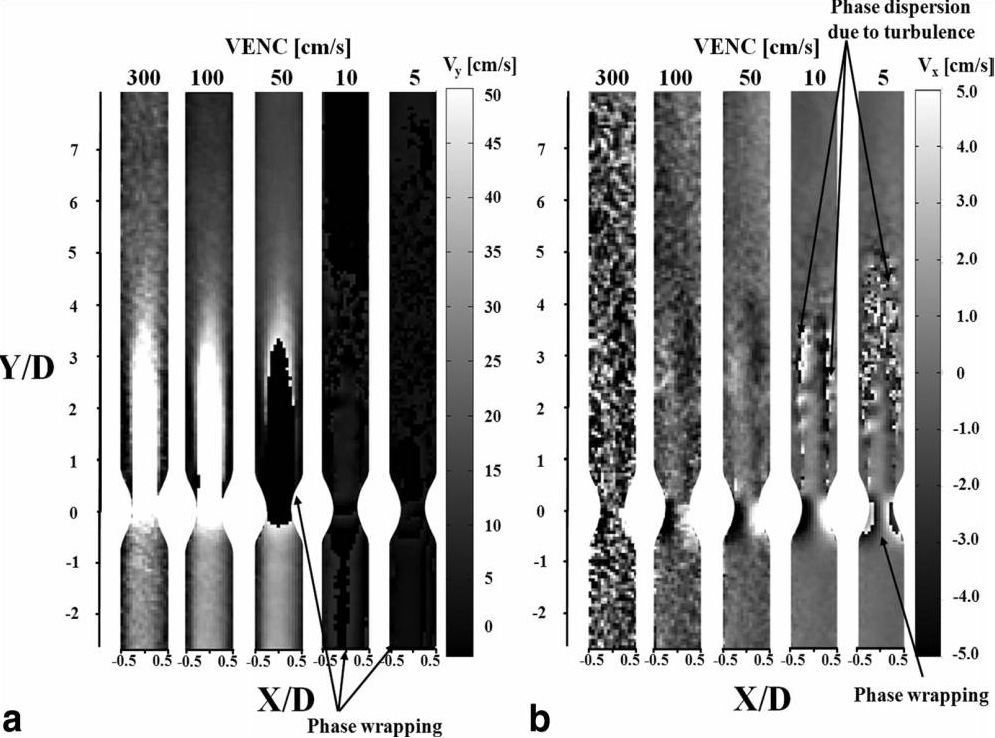
The multi-VENC overlapping method was beneficial for analyzing the low velocity flow structure of the flow field with high velocity dynamic range
Microfluidics for hemorheology
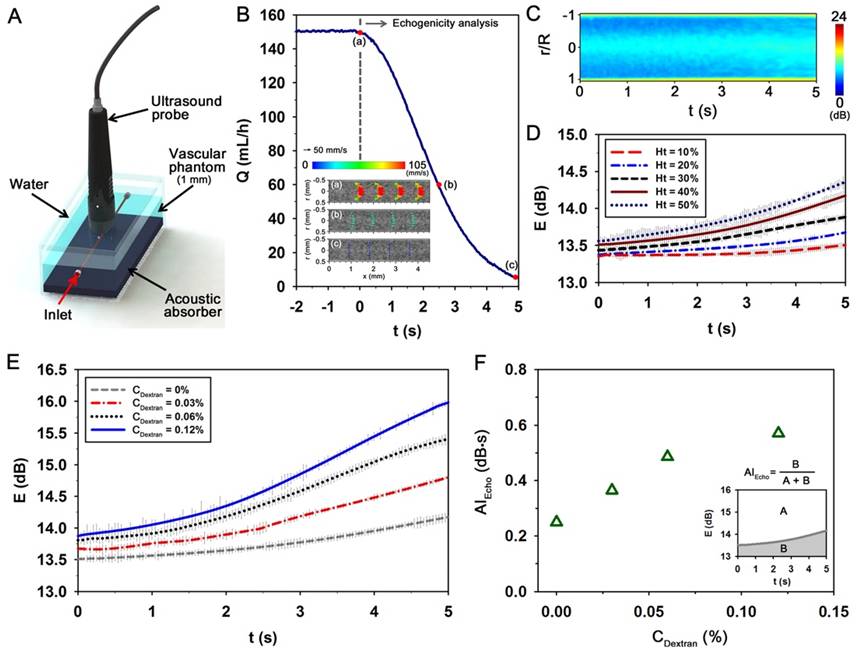
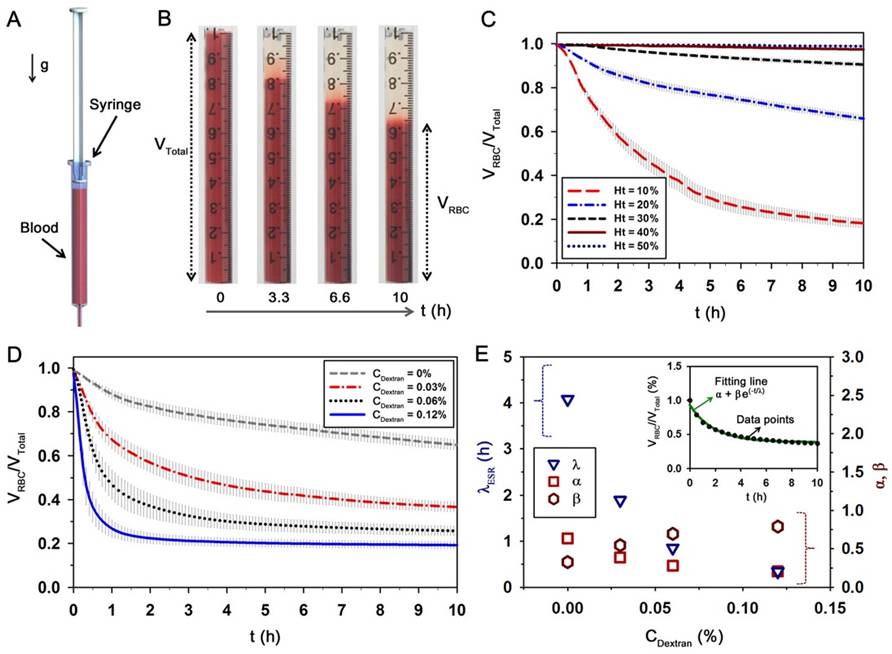
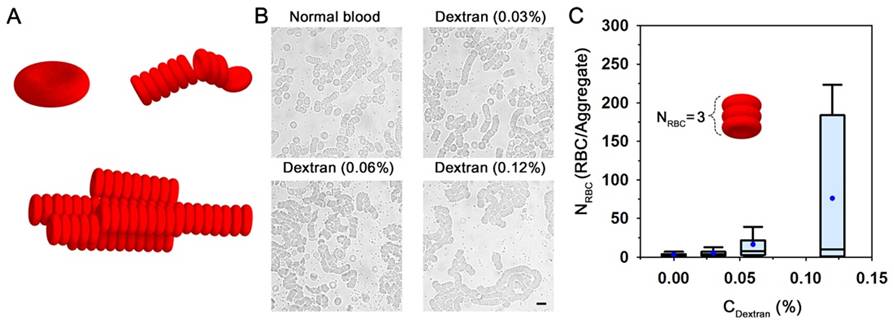
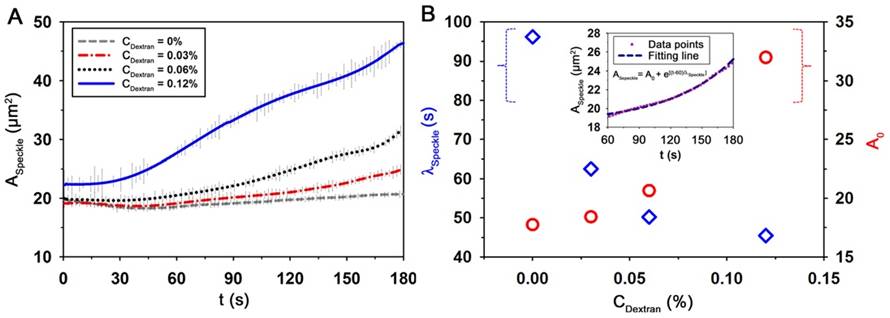
4 indices from hybrid ex vivo rat experiment can be utilized to diagnose hemorheological diseases; diabetic mellitus
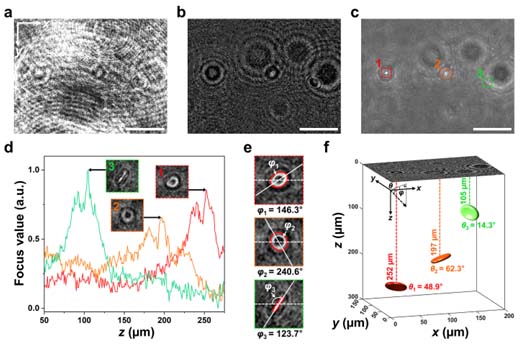
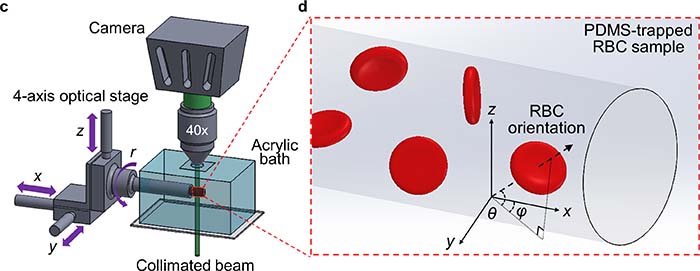
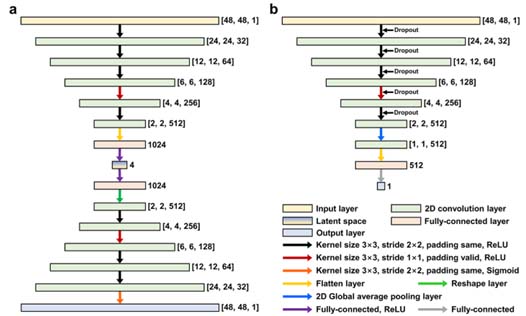
Diagnosis of biological flows & biomimetics: AI-based analysis of 3D position and orientation
of red blood cells using a digital in-line holographic microscopy
DHM setup for acquiring holograms of RBCs
Deep learning network
Data augmentation
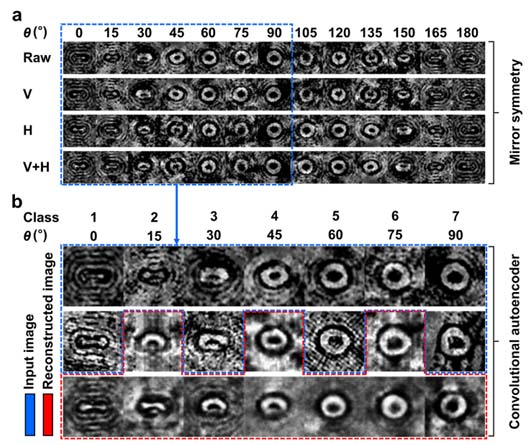
Hologram analysis